
Archives
(PRELIMS Focus)
Category: International Initiatives
Context:
- Germany and India have launched a new Large Grant project (approx. ₹180 crore) under the International Climate Initiative (IKI) to strengthen India’s climate resilience.
About International Climate Initiative (IKI):
- Nature: The International Climate Initiative (IKI) or Internationale Klimaschutzinitiative is a key financial instrument of the German government that funds international projects focused on climate change mitigation, adaptation, and biodiversity conservation in developing and emerging economies.
- Establishment: It was launched in 2008 by the German Federal Ministry for the Environment (BMUV).
- Objective: It aims to support partner countries in implementing and ambitiously developing their Nationally Determined Contributions (NDCs) under the Paris Agreement and achieving goals set by the Convention on Biological Diversity (CBD).
- Current lead: Since 2022, the Federal Ministry for Economic Affairs and Climate Action (BMWK) leads the initiative, working with the Federal Foreign Office and BMUV.
- Thematic diversity: It focuses on four main areas- Mitigating greenhouse gas emissions, Adapting to the impacts of climate change, Conserving natural carbon sinks (REDD+), and Protecting biological diversity.
- Consortium-based funding: Projects are typically implemented by a mix of NGOs, research institutes, international organizations (like GIZ), and the private sector to ensure multidisciplinary expertise.
- Ecosystem-based Adaptation (EbA): A core feature is using nature (e.g., forest restoration, wetland protection) to help human communities adapt to climate risks like floods and heatwaves.
- Innovative financing: It promotes high-risk/high-reward financial mechanisms like blended finance, biodiversity credits, and climate insurance to mobilize private capital.
- Monitoring and learning: It requires rigorous Monitoring, Evaluation, and Learning (MEL) frameworks to ensure that local successes can be scaled up to national or global policies.
Source:
Category: Environment and Ecology
Context:
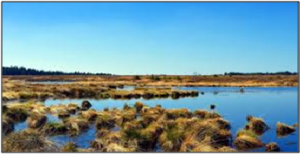
- Two lakes (Mai Ndombe and Tumba) in the Democratic Republic of Congo are releasing carbon that has been locked away for thousands of years in surrounding peatlands.
About Peatlands:
-
- Definition: They are terrestrial wetland ecosystems where waterlogged conditions prevent plant material from fully decomposing, leading to the accumulation of peat (partially decayed organic matter).
- Formation: Peat forms over thousands of years as the rate of organic matter production exceeds its decomposition due to low oxygen (anaerobic) levels.
- Coverage: They cover only 3% of Earth’s land surface but are found in every climatic zone, from boreal regions to the tropics.
- Seepage of carbon: Peat, formed from the accumulation of dead plant material, does not decompose in a water-logged state but when it dries, the organisms that break down plant material revive and the carbon seeps back into the atmosphere.
-
- Composition: In cool climates, peatland vegetation is mostly made up of Sphagnum mosses, sedges and shrubs and are the primary builder of peat. In warmer climates graminoids and woody vegetation provide most of the organic matter.
- Types:
-
-
- Northern and temperate peatlands: Found especially, Europe, North America and Russia where they have formed under high precipitation-low temperature climatic regimes.
- Tropical peatlands: Found in Southeast Asia, mainland East Asia, the Caribbean, Central America, South America, Africa, parts of Australasia and a few Pacific Islands.
-
- Significance:
-
-
- Carbon giant: Peatlands store approximately 600 gigatonnes of carbon—more than all the world’s forests combined.
- Climate regulation: In their natural wet state, they provide a net-cooling effect. Conversely, damaged peatlands contribute about 5% of global anthropogenic CO2 emissions.
- Water security: They hold 10% of the world’s unfrozen freshwater, regulating flows to mitigate floods and droughts.
-
- Biodiversity: They support endangered species like the Bornean orangutan and Sumatran tigers.
- Global conservation frameworks:
-
-
- Global Peatlands Initiative (GPI): A UNEP-led multi-partner effort launched in 2016 to save peatlands.
-
- Brazzaville Declaration (2018): A landmark agreement signed by the Democratic Republic of Congo (DRC), Republic of Congo, and Indonesia to protect the Cuvette Centrale peatlands.
- Ramsar Convention: Many peatlands are designated as Wetlands of International Importance.
-
- UNEP Global Peatland Hotspot Atlas 2024: Highlights that nearly 12% of global peatlands are degraded, with India seeing over 60% degradation in its specific peat-rich areas.
Source:
Category: Government Schemes
Context:
- Recently, the Ministry of MSME organised the 5th meeting of the National MSME Council to review progress of World Bank–Supported RAMP Programme in New Delhi.
About RAMP Programme:
-
- Full form: RAMP stands for Raising and Accelerating MSME Performance.
- Nodal ministry: It is implemented by the Ministry of Micro, Small and Medium Enterprises (MoMSME).
- Apex body: The National MSME Council has been set up by the Ministry to work as an administrative and functional body of the RAMP Programme.
- Tenure: The tenure of the scheme is 5 years (FY 2022-23 to FY 2026-27).
- Association: It is assisted by the World Bank.
- Key objectives:
- Improving access to market and credit for MSMEs
-
-
- Strengthening institutions and governance at the central and state levels
- Improving centre-state linkages and partnerships
- Addressing issues of delayed payments
-
- Greening of MSMEs
- Sub schemes under RAMP:
-
- MSME GIFT Scheme: MSME Green Investment and Financing for Transformation Scheme intends to help MSMEs adopt green technology with interest subvention and credit guarantee support.
- MSE SPICE Scheme: The MSE Scheme for Promotion and Investment in Circular Economy aims to support circular economy projects which will be done through credit subsidy and will lead to realising the dream of MSME sector towards zero emissions by 2070.
- MSE ODR Scheme: The MSE Scheme on Online Dispute Resolution for Delayed Payments is a first of its kind scheme to synergise legal support with modern IT tools and Artificial Intelligence to address the incidences of delayed payments for Micro and Small Enterprises.
Source:
Category: Polity and Governance
Context:
- Recently, the Employees’ State Insurance Corporation (ESIC) commenced the celebration of its 75th Year of Service at Bharat Mandapam, New Delhi.

About Employees’ State Insurance Corporation (ESIC):
- Nature: It is a statutory body formed under the ESI Act 1948.
-
- Nodal ministry: It is functioning under the aegis of Ministry of Labour and Employment, Government of India.
- Mandate: It provides various social security benefits like Medical Benefit, Monetary benefits to the workmen and their family working in the private and public sector.
- Genesis: The first document on social insurance was “Report on Health Insurance” submitted to the Tripartite Labour Conference, headed by Prof. B.P. Adarkar who was acknowledged as Chhota Beveridge. In 1948 Dr. C.L.Katial took over as the 1st Director General of ESIC.
- Inauguration: The ESI scheme was inaugurated in Kanpur on 24th February 1952 (ESIC Day) by then Prime Minister Pandit Jawahar Lal Nehru.
-
- Composition: The Union Minister of Labour heads the ESIC as its Chairman. The Central Government appoints a Director General as the Chief Executive Officer of ESIC.
- Representation: The ESIC comprises members representing crucial interest groups, including employers, employees, the Central and State Governments, representatives of the Parliament and the medical profession.
-
- Coverage: It applies to factories and establishments (like hotels, cinemas, road transport, etc.) employing 10 or more persons. It covers employees drawing monthly wages up to ₹21,000 (₹25,000 for persons with disabilities).
- Key benefits provided:
- Medical benefit: Full medical care for the insured person and dependents.
-
- Sickness benefit: Cash compensation at 70% of wages during certified sickness.
- Maternity benefit: Paid leave for 26 weeks for pregnancy.
- Disablement benefit: Continuous monthly payment for temporary or permanent disability due to employment injury.
- Unemployment allowance: Provided under schemes like Atal Beemit Vyakti Kalyan Yojana (ABVKY) and Rajiv Gandhi Shramik Kalyan Yojana (RGSKY).
Source:
Category: Geography
Context:
- Researchers at Duke University have identified that ocean salinity can amplify the intensity of El Niño by approximately 20%.
About El Nino:
- Nomenclature: El Niño means “Little Boy” in Spanish.
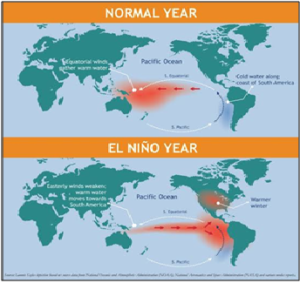
- Definition: It is a recurring climate pattern characterized by the unusual warming of surface waters in the central and eastern tropical Pacific Ocean.
- Frequency: It is the warm phase of the El Niño-Southern Oscillation (ENSO) cycle and typically occurs every two to seven years.
- Mechanism (ENSO Cycle):
- Normal conditions: Strong trade winds blow east-to-west, pushing warm water toward Asia and causing upwelling of cold, nutrient-rich water off the coast of Peru.
-
-
- El Niño phase: Trade winds weaken or reverse. Warm water flows back toward South America, suppressing upwelling. This shifts the Walker Circulation eastward.
- Southern Oscillation: The atmospheric counterpart involving a see-saw of air pressure between Tahiti (Central Pacific) and Darwin (Australia). A negative Southern Oscillation Index (SOI) indicates El Niño.
-
- Factors impacting El Nino:
- Trade wind strength: The primary driver; weaker winds trigger the eastward movement of warm water.
-
-
- Ocean-Atmosphere coupling: A feedback loop where warming water further weakens winds, which in turn warms the water more.
- Thermocline depth: The depth of the transition layer between warm surface water and cold deep-water influences how much heat is available to fuel the event.
-
- Impacts on India:
- Monsoon suppression: El Niño is generally inversely related to the Indian Monsoon. It shifts the descending limb of the Walker Cell over the Indian Ocean, causing high pressure and suppressed rainfall.
-
- Agriculture: Leads to lower production of Kharif crops (rice, sugarcane, cotton) and increases food inflation.
- Heatwaves: Strongly correlated with more frequent and intense summer heatwaves in India.
- Counter-factors: Not all El Niño years lead to drought. A positive Indian Ocean Dipole (IOD) can sometimes offset El Niño’s negative impact, as seen in 1997.
Source:
(MAINS Focus)
(UPSC GS Paper III – Inclusive growth and issues arising from it; GS Paper I – Indian Society: Poverty and developmental issues; Social empowerment)
Context (Introduction)
Income mobility analysis for 2014–2025 shows that downward movement across income groups has outpaced upward mobility, especially in rural and socially disadvantaged segments. This signals structural constraints in India’s growth model beyond what poverty and inequality ratios reveal.
Key Data Trends (2014–2025)
- Share of households experiencing downward mobility nearly doubled from 14% (2015) to 26.8% (2025).
- Households remaining in the same income group fell from over 70% to below 50%.
- Upward mobility rose modestly from 14.1% to 23.5%, but consistently lagged behind downward shifts.
- By 2025, nearly 29% of rural households were worse-off relative to 2014.
- Downward mobility increased across caste groups, particularly among OBC and SC households, while upward mobility among SCs remained muted.
- The data indicate that more households are slipping down the income ladder than climbing up, pointing to structural economic and social constraints.
Main Reasons Behind Rising Downward Mobility
- Rural and Informal Sector Distress: Nearly 29% of rural households were worse-off in 2025 relative to 2014. With over 80% of India’s workforce informal (Periodic Labour Force Survey), shocks such as demonetisation, GST transition, and COVID-19 disproportionately affected small enterprises, agriculture and migrant labour.
- Unequal Post-Pandemic Recovery (K-shaped Growth): Organised, capital-intensive sectors recovered faster post-2020, while informal employment lagged. PLFS data show urban unemployment and labour force participation fluctuations during 2020–22, indicating fragile recovery among lower-income groups.
- District-Level Income Dispersion Statistical findings indicate that higher district-level inequality correlates with greater downward mobility. Concentration of growth in select urban districts restricts mobility in lagging regions.
- Structural Social Barriers: SC and OBC households experienced sharper downward mobility; Muslim households exhibited weaker upward mobility. Historical asset deprivation, occupational segmentation and unequal access to credit continue to constrain advancement (NSSO and SECC patterns).
- Low Employment Elasticity of Growth: Economic growth has been driven by capital-intensive sectors (infrastructure, digital services), generating limited broad-based employment. Manufacturing’s share in employment has not expanded proportionately despite policy focus.
Way Forward
- Boost Employment-Intensive Manufacturing (Economic Survey, PLI Framework): The Economic Survey repeatedly emphasises labour-intensive manufacturing (textiles, food processing, electronics assembly) for job creation. Expanding Production-Linked Incentive (PLI) schemes with explicit employment targets and linking incentives to job creation metrics can improve mobility.
- Strengthen Rural Incomes through Agriculture Diversification (NITI Aayog, Doubling Farmers’ Income Reports): NITI Aayog and Ashok Dalwai Committee reports stress crop diversification, value addition and Farmer Producer Organisations (FPOs). Scaling up FPO coverage (currently over 10,000 FPOs targeted) and improving agri-value chains can stabilise rural incomes.
- Expand and Modernise Social Protection (World Bank, ILO Recommendations): The World Bank’s State of Social Protection Report highlights the need for adaptive safety nets. Strengthening MGNREGA with timely wage payments (as CAG flagged delays), expanding urban employment pilots, and universalising portable social security under e-Shram (covering 29+ crore workers registered) can cushion downward shocks.
- Invest in Human Capital (NEP 2020, National Health Policy 2017): India’s public health expenditure (~2.1% of GDP as per Economic Survey) remains modest. Increasing health spending to 2.5% GDP (National Health Policy target) and improving foundational learning outcomes (ASER reports show learning deficits) are critical for long-term mobility.
- Reduce Regional Inequality (Aspirational Districts Programme): The Aspirational Districts Programme (112 districts) uses real-time monitoring in health, education and agriculture. Expanding this model to “Aspirational Blocks” and linking fiscal transfers to outcome-based indicators can reduce spatial mobility gaps.
- Improve Access to Credit and Assets (RBI Financial Inclusion Data): Jan Dhan coverage exceeds 50 crore accounts, but credit penetration remains unequal. Strengthening Mudra lending transparency, improving SHG-bank linkages (NRLM), and expanding digital credit infrastructure can help lower-income households invest productively.
- Strengthen Labour Market Data and Mobility Tracking: Institutionalising panel-based income mobility tracking (through NSSO/PLFS augmentation) can help policymakers identify vulnerable groups early and design targeted interventions.
Conclusion
The rise in downward income mobility between 2014 and 2025 reflects structural vulnerabilities in employment, regional development, and social equity. Evidence from labour surveys, district inequality patterns, and sectoral performance suggests that inclusive growth requires employment-centred industrial policy, robust social protection, and sustained investment in human capital to restore upward mobility and social stability.
Mains Question
- The rise in downward income mobility in India during 2014–2025 reflects structural constraints in the growth process. Analyse the key economic and social factors responsible and suggest evidence-based policy measures to strengthen inclusive mobility. (250 words, 15 marks)
Source: The Hindu
(UPSC GS Paper II – International relations: India and its neighbourhood; Bilateral, regional and global groupings and agreements involving India and/or affecting India’s interests)
Context (Introduction)
Prime Minister Narendra Modi’s 24-hour visit to Jerusalem marked a significant upgrade in India–Israel ties to a “Special Strategic Partnership”, but raised concerns over India’s calibrated position on Palestine amid deepening geopolitical tensions in West Asia.
Setting the Tone: Key Outcomes
- Upgrade of ties to a Special Strategic Partnership.
- Signing of 15+ MoUs, including a critical technologies partnership in AI, agriculture, culture and education.
- Agreement to facilitate 50,000 Indian workers in Israel over five years.
- Revival emphasis on I2U2 (India-Israel-UAE-U.S.) and IMEC (India-Middle East-Europe Economic Corridor).
Main Arguments
- Strategic Deepening of India–Israel Ties: The visit demonstrated strong political signalling. Israeli Prime Minister Benjamin Netanyahu personally escorted Mr. Modi throughout the visit, underscoring Israel’s diplomatic emphasis. The partnership expands beyond defence into emerging technologies, workforce mobility and regional economic initiatives.
- Timing and Political Context: The visit occurred amid Israel’s growing international isolation over high civilian casualties in Gaza (over 72,000 deaths reported) and controversy over West Bank settlement plans. Several European nations, including Germany, France and the U.K., have publicly criticised Israel’s policies.
-
- For Mr. Netanyahu, facing elections and scrutiny over governance and security lapses in 2023, the visit carries domestic political value.
- India’s Position on Palestine: In his Knesset speech, Mr. Modi referred only indirectly to Palestinian sovereignty, endorsing the U.S.-led Gaza Peace Initiative and the two-state solution. However, he did not explicitly reference civilian casualties in Gaza.
-
- This marks a nuanced but visible shift from India’s historically vocal support for Palestinian self-determination. The absence of a concurrent visit to Palestine contrasts with India’s earlier diplomatic balancing.
- Regional Implications: India reaffirmed commitment to multilateral initiatives such as:
- I2U2 grouping (India-Israel-UAE-U.S.)
- IMEC corridor linking India to Europe via West Asia
- This signals New Delhi’s belief in regional economic integration despite heightened polarisation and security tensions, including possible U.S.–Iran conflict risks.
Concerns and Strategic Risks
- Erosion of Strategic Autonomy: A perception of “standing firmly with Israel” may affect India’s ties with Arab states and Iran, which expect balanced engagement.
- Energy and Diaspora Stakes: West Asia accounts for a major share of India’s energy imports and hosts over 8 million Indian expatriates; regional instability carries economic and humanitarian implications.
- Diplomatic Credibility: India has traditionally supported a two-state solution rooted in international law. A perceived dilution could weaken India’s moral positioning in multilateral forums.
- Regional Polarisation: If conflict escalates (e.g., Israel–Iran confrontation), India may face pressure to take sides, affecting trade corridors and connectivity projects like IMEC.
Way Forward
- Reaffirm Two-State Solution: Publicly reiterate support for Palestinian sovereignty consistent with UN resolutions and India’s historical position.
- Parallel Outreach to Palestine and Arab States: Follow-up diplomatic visits and humanitarian engagement to restore calibrated balance.
- Preserve Strategic Autonomy: Maintain multi-alignment by deepening ties with Israel while sustaining strong partnerships with Gulf states and Iran.
- Safeguard Connectivity Initiatives: Ensure IMEC and I2U2 projects remain economic platforms insulated from geopolitical tensions.
- Humanitarian Diplomacy: Support ceasefire efforts, humanitarian assistance to Gaza, and dialogue mechanisms to reinforce India’s image as a responsible global actor.
Conclusion
While the visit significantly strengthens India–Israel bilateral engagement, its broader impact will depend on how effectively India preserves its traditional diplomatic balance in West Asia. Sustaining strategic autonomy while advancing economic and technological partnerships remains the key test for Indian foreign policy.
Mains Question
- India has recently upgraded bilateral ties with Israel however critics have raised concerns regarding India’s traditional West Asia policy. Critically examine (250 words, 15 marks)
Source: The Hindu